RODER presents the new DATASINK 100 software for the acquisition, printing and archiving of data acquired by sensors and measuring instruments for dimensional and geometric control
Used in all applications where a tool is needed cheap and easy to use, DATASINK 100 allows you to speed up your quality control, monitoring and process certification procedures.
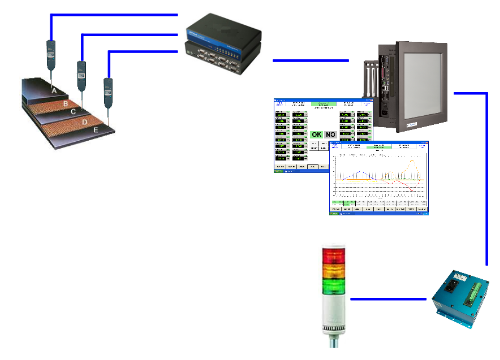
Through an acquisition cable or a wireless connection it is possible to transfer the data acquired by portable instruments or measuring machines to a file or to a graph for thicknesses, widths, profiles, diameters, ovalizations, deformations, roughness, lengths, heights, depths, radii of curvature, angles, vibrations, oscillations, straightness.
DATASINK 100 it was designed to solve simple data acquisition applications executed on a single instrument. The instrument data can be acquired on a programmable time basis (it could be once per second, once every 15 minutes or once a day, based on the programming made) or it can be acquired at the request of the operator (by pressing a key on the keyboard or pedal) or through an external signal (relay ', button, PLC).
Whatever the acquisition method, the data is introduced into a list of progressive values and compared with the predetermined tolerance thresholds.
If the value is within the tolerance range, the system stores it in the local database.
If the value is outside the tolerance range or if it is in the pre-alarm range, the system can be programmed to generate notifications (warnings) or physical alarms (visual, acoustic or on external relays).

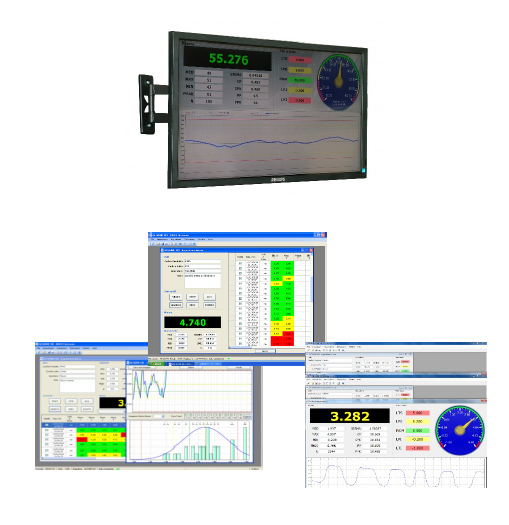
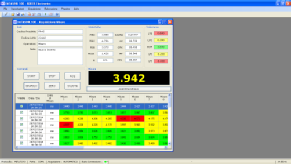
It is possible to monitor in real time the number of acquired values, the minimum-maximum-average value acquired, the dispersion value (sigma) and the statistical process coefficients (Cp and Cpk).
All values stored in the database can be viewed both in trend format (process trend) and in terms of distribution of acquired values (Gaussian distribution).
The database can be exported in Excel or CSV format for use by third-party software.
DATASINK 100: Benefits

- Automatic acquisition measurements from manual measuring instruments, sensors or measuring machines
- No possibility of error in reading or transcribing the data
- Ability to programming of regular intervals of data acquisition
- Reliable and objective documentation on the number of measures taken and the temporal regularity of the acquisition
- Ability to deal large amounts of data automatically and intuitively
- Simple graphical display and immediate of the acquired measurements
- Real-time statistical analysis of the acquired measures
- Automatic generation of PDF reports also with company logo
- Possibility of exporting the acquired data in Excel or text format
- Possibility of managing production batches and multiple acquisition processes by dividing the data into several distinct files
What can DATASINK 100 do?
For production control
- Acquisition of measurements from gauges, micrometers, digital comparators, altimeters, load cells, torque meters and many other instruments in a simple and immediate way.
- Statistical control of dimensional, geometric and functional parameters: thickness, height, diameter, width, depth, bore, torque, hardness, bending, oscillation, eccentricity and many others.
- Real-time calculation of the minimum, maximum, average value.
- Real-time calculation of dispersion (Sigma) and statistical coefficients of process capacity (Cp and Cpk).
- Real-time visualization of the production trend and of the distribution of the acquired values.


To acquire expansion, displacement, deformation and flexion measurements
- Automatic acquisition with pre-established time frame (from some samples per second, up to some samples per day)
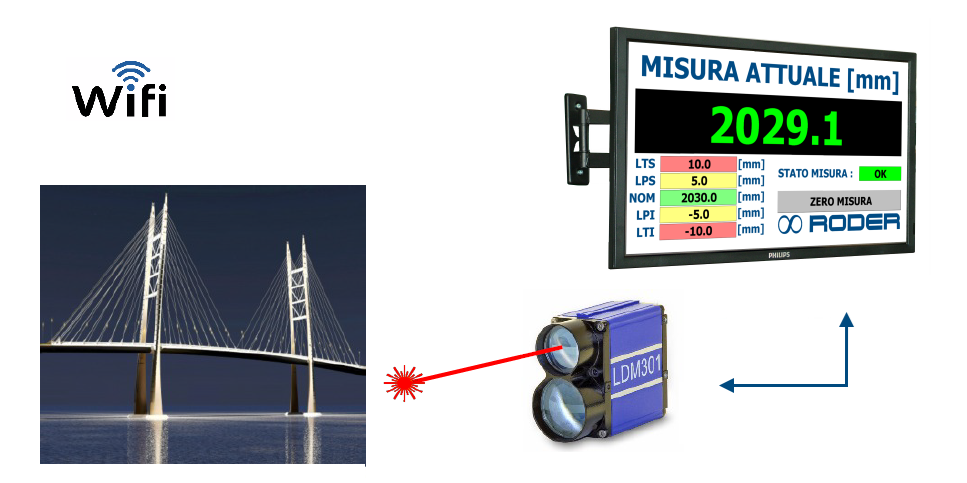
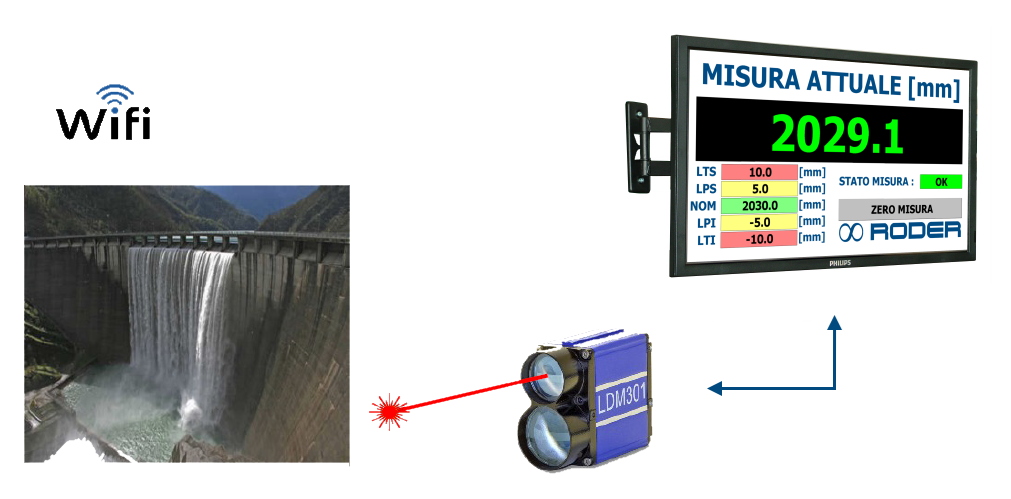
- Connection with sensors and transducers via cable or wireless connection
- Real-time calculation of the minimum, maximum, average value.
- Real-time display of the behavior detected by the sensor.
- Possibility to generate real-time alarms or pre-alarms when the monitored quantity leaves the pre-established range of values.

To acquire oscillation, straightness, eccentricity measurements on control benches
- Automatic acquisition with pre-established time frame (from some samples per second, up to some samples per day)
- Connection with sensors and transducers via cable or wireless connection
- Real-time calculation of the minimum, maximum, average value.
- Real-time display of the behavior detected by the sensor.
- Possibility to generate real-time alarms or pre-alarms when the monitored quantity leaves the pre-established range of values.


For profile measurements or dimensional changes
- Automatic calculation of oscillation, straightness and eccentricity values with the help of test benches and mechanical equipment.
- Real-time production control with automatic calculation of statistical production parameters (Sigma, Cp and Cpk)
- Display of profiles or dimensional variations with the aid of mechanical positioning and sliding sensor equipment.
- Export of data in text or Excel format for subsequent analysis of values


To keep under control production parameters or physical quantities
- With the "continuous monitoring" function it is possible to keep a certain physical quantity under control and generate alarms when the measured value is outside the set value range
- Simultaneously with continuous monitoring, it is possible to archive data on a regular basis to check the progress and behavior of the process even after some time.

Why use DATASINK 100?
In many measurement, control, certification or scientific research applications it is necessary to report the data obtained from manual measuring instruments (gauges, micrometers, probes, comparators, thickness gauges, etc.) on an electronic document or on a graph. test and inspection (profilometers, hardness testers, roughness gauges, leak test benches, etc.).
Generally the simplest and most widespread procedure requires that the operator, during the measurement operations, write down the measurements obtained from the measuring instrument on a sheet (with regular intervals) and then proceed with the archiving in electronic format of the data obtained manually.
In some cases the data obtained must be transformed into graphs (to allow a more significant evaluation of the process) or it is necessary to carry out mathematical calculations on the acquired samples (statistical calculations, detection of the minimum and maximum peaks, calculation of the production coefficients of the line of production).
The manual acquisition / transcription / calculation procedure involves some drawbacks including:
- Possible errors of data transcription while reading the instrument or during data transfer to the PC
- Need to interrupt the measurement procedure in order to record the data (in some cases the measurement takes place with the help of both hands and it can be inconvenient or impossible for the operator to carry out both operations)
- The time for the transcription of the data can be relevant if the number of data to be acquired is considerable.
- In order to be able to process the data graphically or numerically, a transcription must in any case be carried out on a special software (Excel or similar)
- The number of samples per second that can be acquired is not very high (a fast operator cannot annotate more than 1 measure per second)
- Mistakes can be made in reading and subsequent transcription of data.
DATASINK 100 allows to speed up all these operations and in particular:
- Through a traditional connection cable or with a wireless connection DATASINK 100 allows you to transfer the data present on the measuring instrument directly to a PC (fixed or portable) eliminating the manual reading and transcription operation.
- It does not set limits on the limit of consecutive acquired measures and allows to acquire up to 10 measures per second.
- It is possible to program the automatic acquisition of a predetermined number of points at a constant and predetermined time interval that can go from a few hundred milliseconds to several hours, guaranteeing total acquisition times even in the order of days or months.
- Graphical representation is an automatic function of DATASINK 100 with relative paper printing or archiving in graphic format (jpeg or similar).
- It allows you to store an unlimited amount of samples in text format in a special file.
- Through the data transfer function to an Excel spreadsheet, it is possible to transfer the acquired data to a work environment already in use or within a consolidated production management and control system.
- Through the Excel functions it is possible to integrate automatic calculations on production data acquired with customized formulas or with non-standard graphs.
Furthermore, DATASINK 100 allows to use for the measurement instruments already in possession, widely used or in any case purchasable with modest investments. Indeed DATASINK 100 acquires data from measuring instruments with Digimatic protocol, (standard created by Mitutoyo but used by many other manufacturers of measuring instruments) or with Mahr, Tesa, Astech, Zumbach protocol.
DATASINK 100 applications
Deformation measurement

Thickness measurement on multilayer product
Radial and axial oscillation measurement

Displacement and deformation measurement

Measurement of diameter, ovalization, thickness, concentricity

Profile, curvature, position measurement

Measurement of diameter and ovalization with laser micrometer

Who uses DATASINK 100
Technicians and quality control managers in the metrology laboratory

Technicians and quality control managers in the production line

Universities, research centers, R&D departments, schools and vocational training institutes

Machine builders and test benches

Testers, experts, inspectors and certifiers of operating structures

Which instruments can be connected to DATASINK 100?
DATASINK 100 can acquire, view and record data from different types of sensors and transducers. Once acquired, the data can be viewed on the monitor and compared with tolerance thresholds in order to be able generate alarm signals, it can be stored in files for later processing or it can be simply represented in graphic form (long-term process trend).
It is possible to acquire and process data from sensors and measuring instruments of the following manufacturers:
MITUTOYO:
All bench instruments (gauges, micrometers, comparators, bore gauges, altimeters, optical lines, etc.) and all measuring systems equipped with Digimatic interface
ZUMBACH:
All LASER micrometers of the ODAC series and all process controllers equipped with serial output with ASCII protocol
KEYENCE:
All triangulation sensors of the IL family, the contact transducers of the GT2 family, the light barrier sensors of the IG family.
ASTECH:
All LASER distance meters of the LDM41 / 42 family and of the LDM301 family